Principles
-
determination of radon potential of a building site (= detailed radon
survey) is obligatory with the purpose to classify the building site
area from the point of view of the risk of radon penetrating from the
soil into the building
-
proposal of optimal preventive strategy corresponds to local conditions
(radon index of a building site) and to building type (radon index of a
building)
-
preventive measures are realized using radon-related construction products; test methods are available
-
design and installation of preventive measures in accordance with the Czech National Standard
-
efficiency of preventive measures is controlled
Decision making in the pre-construction phase
The decision whether or not a dwelling needs radon protection can be
based not only on radon risk mapping or modelling, but also directly on
the assessment of radon potential at a given place - on a building site
characterization.
The soil characteristics are measured in-situ and protective measures
are designed with respect to the measured properties of the soil and to
the dwelling design (Czech Republic, since 1991).
Main advantage of the method:
It is a site-specific, individual approach that enables to propose an
optimal preventive strategy corresponding to local conditions.
Disadvantages - connected for example with temporal changes of measured parameters - are not critical.
Results of the building site characterization are used for the design of protective measures
(This approach is obligatory in accordance with the Czech Atomic Law).
If the radon index is other than low (i.e. medium, or high), the building must be protected against radon.
Protective measures are designed and installed in accordance with the
Czech National Standard (CSN 730601 Protection of houses against radon
from the soil).
Description of the method - Building site characterization, link (pdf)
Terminology
Radon index of a building site (RI):
index indicating the level of risk of radon release from the bedrock,
surface material, and\or soil. The categories are low, medium, and high.
Radon index of a building (RB):
index expressing the degree of required radiation protection a building
needs against radon penetration. It is derived from the RI, the
building foundation type, and the characteristics of the underlying
soil or bedrock.
Radon potential of a building site (RP): the value expressing the radon index of the building site.
(If RP < 10, then RI is low; if 10 RP < 35, then RI is medium; if 35 RP, then RI is high.)
Techniques
Simple, low-cost sampling and measuring techniques are used.
The determination of radon index of a building site based on
- measurement of soil-gas radon concentration,
- in situ measurement of soil permeability, or expert evaluation of soil permeability (description of vertical soil profile)
Uniform sampling and measuring depths of 0.8 m below the surface are used.
When a building site of one family house is evaluated, it is required to realise at least 15 soil-gas sample measurements.
If the building area is larger than 800 m2, measurements are made at a scale 10 x 10 m.
The third quartile (= the 75% percentile) of the data set is the decisive value.
Values of soil-gas radon concentration smaller than 1kBq.m-3 are
excluded from the evaluation because of possible sampling error.
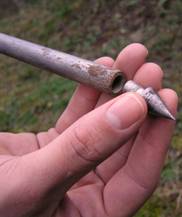
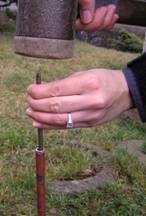
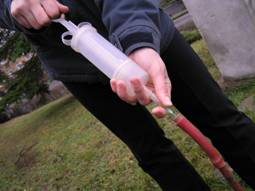
Example: collection of a soil-gas sample
Samples of soil-gas from the depth 0.8 m are collected by using a small
diameter hollow steel probe with a free sharpened tip and a syringe:
(a) Inserting the sharpened tip into the lower end of the probe.
(b) The sharp tip is moved a few centimetres lower - this action creates a cavity at the lower end of the probe.
(c) Soil-gas sample collection using a syringe.
Evaluation
If the results of both soil gas radon concentration measurements and in
situ permeability measurements are available for all measuring points,
a radon potential (RP) model can be used for determining the RI (see
Fig. 1). To follow continuity with the formerly used method the
equation describing the RP parameter is optimally defined as:
RP = ( CA - 1 ) / ( - log k - 10 ).
The third quartile of the soil gas radon concentration data set (cA75)
and the third quartile of the permeability data set (k75) are the input
values for assessing a building site using the RP model. The RP value
enables the determination of RI as low, medium, or high (if RP < 10,
then RI is low; if 10 <= RP < 35, then RI is medium; if 35 <=
RP, then RI is high).
For numerical values of soil gas radon concentration and the expert
evaluation of soil permeability (given as low, medium, or high), the
assessment procedure is based on the classification table (see Tab 1).
Tab. 1. Radon index assessment - classification table
|
Radon
index (RI)
category
|
Soil gas radon
concentration
(kBq.m-3)
|
|
Low
|
cA<30
|
cA<20
|
cA<10
|
|
medium
|
30<=cA<100
|
20<=cA<70
|
10<=cA<30
|
|
High
|
cA>=100
|
cA>=70
|
cA>=30
|
|
|
low
|
medium
|
high
|
|
|
permeability
|
Fig. 1. Radon potential (RP). The model for the assessment of RP is
based on the former RI classification table (Tab. 1). The amendment
implements continuous lines (in red), which substitute former
fractional lines separating low, medium and high RI. This substitution
enables a more precise assessment in border cases.
Problems related to the building site characterization
- (concise information)
Comparison of large-scale radon risk maps and results of detailed in-situ measurements
The described method for the building site characterization is not
assigned for radon risk mapping. In the Czech Republic, radon risk maps
are used mainly to direct the search of existing (old) houses with
elevated radon levels, not to design preventive protective measures in
new buildings. On the other hand, results of building site
characterization are commonly used for the construction of radon risk
maps.
Four comparisons were made in 1992, 1995, 2002 and 2007.
The first two comparisons were based on the assessment of differences
between regional radon risk maps in the scale 1:200000 and results of
detailed radon surveys. They concerned 630 and 968 building sites,
respectively.
The comparisons showed, that the large-scale maps are generally
reliable, the satisfactory reliability of radon risk maps was observed
at a large number of areas (62,9 %; 56,7 % resp.). When the bedrock is
formed by Cretaceous sediments or by granites or granodiorites, and/or
the cover formed by loess and loess loams - a satisfactory coincidence
between the results of building site characterization and the radon
risk map prediction (about or more than 70% of cases) was observed.
Significant differences were found in areas with larger variability of
soil environment (river terraces, or layers influenced by anthropogenic
activity). In areas with the Quarternary cover formed by river
terraces; or with some special rock types - chlorite-sericite phylite -
detailed radon surveys did not confirmed the expected risk at more than
60% of building sites.
Observed differences confirmed the usefulness of a direct building site
characterization. The comparison found and demonstrated another
disadvantage of the radon maps as well. The
lowest reliability, even lower than 30 %, was found in expected high
risk areas, i.e. with respect of the usefulness of maps in areas of the
main interest (the search of existing houses with higher indoor
values). Therefore, the Czech geological survey has been publishing new
radon risk (index) maps in the scale 1:50000 since
1999.
The third and the fourth comparison were focused on
the reliability analysis of those new radon risk maps in the scale 1:50
000. The reliability evaluation of maps 1:50000 is more
complicated, because the maps include the fourth category, called
intermediate, which is not defined for detailed building site
characterization and has in fact no corresponding
counterpart.
In 2002, the reliability of radon risk prediction
maps was analysed by comparing data from detailed radon surveys with
data from the corresponding 4 radon map sheets. We concentrated on the
map sheets with expected all radon index categories or with predicted
low and intermediate categories. The reliability was similar –
about 62,2 %, when we used the rule that the intermediate category in
the map corresponded to both low and medium detailed risk. But the
differences between the indications from the map and the data from the
survey were again substantial. The spatial distribution of radon
indices was induced mainly by variations in geological conditions,
which can only be characterized by a thorough geological survey. A
geological map of 1: 50 000 scale, as a basis for radon risk map,
cannot register such details.
Finally, the comparison in 2007, when the whole teritory of Czech
Republic had been covered by those radon maps, had to answer the
question: “Is there a possibility to use the radon risk maps in
the scale 1:50000 for determination of radon index at a specific site
and for preventive measures in new buildings without detailed in-situ
investigation?”. Hundreds of detailed radon index assessments
(i.e. thousands of soil-gas radon concentration measurements) were
compared with expected radon index categories in chosen 5 map sheets.
Three ways (approaches) of testing the radon risk maps reliability have
been used. The first one corresponds to the main purpose of maps, i.e.
searching for existing houses with elevated radon levels, and it
minimizes the influence of the intermediate category. In that case it
is possible to use again the rule, that the intermediate category in
the map corresponded to both low and medium detailed risk (the most
important is the agreement in higher risks). The relevant reliability
has varied from 63,0 to 67,1 %.
The second reliability test describes the probability, how often it is
possible to find the same category using the detailed assessment and/or
reading the map. It takes into account the splitting of the
intermediate category to both low and medium ones. The corresponding
value has varied from 45,2 to 51,5 %.
In the third comparison, the doubtful intermediate category has been
excluded. We have focused on the reliability of determination of a
specific category. In areas marked as low risk areas in the maps, the
reliability has been 37,3 %, i.e. in 62,7 % we have found a higher
category during the detailed survey (the risk of underestimation 62,7
%). As for the medium risk, the reliability has been 52,9 %, the risk
of underestimation 33,8 % and the risk of overestimation 13,3 %. As for
the high risk areas, the reliability has been similar, 52,7 %, and the
corresponding risk of overestimation 47,3%.
The answer of the above mentioned question was relatively easy. No, the
radon risk maps cannot be recommended to be used for the determination
of radon index of building sites for new buildings.
On the other hand, the new maps have improved the input conditions for
searching the old houses with elevated indoor radon levels.
References:
5. Neznal, M., Neznal, M. and Barnet, I. Comparison between Large Scale
Radon Risk Mapping and Results of Detailed Radon Surveys. In:
Proceedings of the Conference I.A.I. Quality Standards for the Indoor
Environment, Prague, 107-115 (1992)
6. Neznal, M., Neznal, M. and Šmarda, J. Testing of Radon Risk
Maps Reliability. In: Barnet, I., ed. Radon Investigations in CS. Vol.
4. Praha: Geological Survey, 12-17 (1993)
14. Neznal, M., Neznal, M. and Šmarda, J. Comparison between
Large Scale Radon Risk Maps and Results of Detailed Radon Surveys. In:
Barnet, I. and Neznal, M., eds. Radon Investigations in CR. Vol. 6.
Praha: Geological Survey, 16-22 (1996)
Soil-gas radon concentration - Variation with depth
The research dealing with this topic was performed in 1993, 1994.
Eight reference areas with various geological settings were chosen with
respect to the characteristics of the underlying bedrock, origin,
permeability and stratification of soil deposits, and depth and
variability of groundwater level.
Soil-gas radon concentration as well as soil permeability were determined at depths of 0.3, 0.6, 0.9, 1.2 and 1.5 m.
Fifteen measurements were made at each depth and at each reference area - average values were evaluated.
Variability of radon concentration with depth was different at areas with different geological characteristics.
Almost constant soil-gas radon concentration was observed at areas with
relatively homogeneous and highly permeable Quarternary fluvial sands
covered by clayey loams, or in case of highly permeable eluvial
deposits of Cretaceous sediments - sands covered by sandy loams.
Insignificant increase of radon concentration with depth was measured
at areas with relatively homogeneous and medium permeable loess loam.
Significant increase of radon concentration with depth was observed at
areas with granodiorites characterized by extensive weathering and by
high radon potential.
The similar results were measured during the research at four areas in 1999
- variability of radon concentration with depth depends on geology.
References:
9. Neznal, M., Neznal, M. and Šmarda, J. Variability of Radon
with Depth in Various Soil Profiles. In: Barnet, I. and Neznal, M.,
eds. Radon Investigations in CR. Vol. 5. Praha: Geological Survey,
55-61 (1994)
Soil-gas radon concentration - Temporal variations
As the protection of new buildings against radon penetration from the
ground in the Czech Republic is based on in-situ soil-gas radon
concentration measurements, possible influence of temporal variations
of the measured parameter on the evaluation results is very important.
Several long-term research projects dealing with this problem have been carried out.
1990 - 1992: A 14-month observation of soil-gas radon concentration
using two permanently installed probes at two test sites (distanced
several meters) with similar geological structure - sandstone
weathering residuum covered by fine-grained sand with loamy admixtures.
Results and conclusions:
Site 1:
Range from 34.1 kBq.m-3 to 91.8 kBq.m-3 (number of measurements: 270),
arith. mean = 60.2 kBq.m-3, SD = 11.3 kBq.m-3, SD/mean = 0.19.
Site 2:
Range from 3.0 kBq.m-3 to 6.3 kBq.m-3 (number of measurements: 270),
arith. mean = 4.3 kBq.m-3, SD = 0.6 kBq.m-3, SD/mean = 0.15.
The general temporal pattern was represented by higher winter/spring
and lower summer/autumn values, but seasonal variations were not so
large. Short-term changes of radon concentrations at site 1 and at site
2 were often different, or even opposite.
1992 - 1993: Repeated soil-gas sampling at five reference areas with
different geological structure and soil permeability; two different
soil-gas sampling methods were tested:
(a) "probes" = standard sampling method using small-diameter probes
(The probes were pounded into the ground anew every measuring day, i.e.
the location of measuring points was not exactly constant.),
(b) "chambers" = sampling from cylindrical chambers permanently installed in the soil.
Measurements were repeated nine times at 25 measuring point at each
reference area, using both methods. Average values of soil-gas radon
were compared.
Results and conclusions:
- weak relationship between average soil-gas radon concentration and
soil temperature, and between radon concentration and soil moisture;
- it seemed to be different for different sampling methods;
- different correlations coefficients were obtained at areas with different geological structure.
Observed temporal variations of soil gas radon concentrations often
correspond not only to real variations of the measured physical
parameter, but also to fluctuations and errors connected with sampling
and measuring techniques.
The influence of changing meteorological conditions may not be as
important as the influence of changing sampling depth, the influence of
geological heterogenities, and the influence of sampling and measuring
errors.
The highest values of average soil-gas radon concentration obtained at
any area during a 1-y period were about two times the lowest ones (more
exactly from 1.5 to 2.5). The ratio of the limits that separate
different categories ranges from 3 to 3.5.
The probability that any area will be classified as a low risk area and
after several months as a high risk is therefore very low.
The reproducibility of the radon risk classification seems to be satisfactory.
1994 - 1995: Measurements at the test site on the surface of the uranium mill tailings
have confirmed previous results.
Temporal variability (SD/mean) decreased with the depth below the surface:
SD/mean < 0.10 at the depths of 1.5 and 0.8 m;
SD/mean ranging from 0.13 to 0.25 at the depths from 0.5 to 0.3 m.
2000 - 2001: Repeated measurements of soil-gas radon concentrations at several test sites
A satisfactory reproducibility of the evaluation based on in-situ soil-gas radon concentration measurements was confirmed again.
The sampling depth of 0.8 m represents a relatively good compromise
between the required reduction of errors caused by the radon
concentration variability and the required reduction of weather effects
on the one side and the practicability of the method under field
conditions on the other side.
It is evident that all conclusions are valid for the geological and
meteorological conditions that are typical for the Czech Republic, or
maybe for Central Europe. The situation in other countries with a
substantially different climate or geology may be different.
References:
3. Neznal, M., Neznal, M. and Šmarda, J. Temporal Variations od
Soil Gas Radon Concentration. In: Barnet, I., ed. Radon Investigations
in CS. Vol. 3. Praha: Geological Survey, 6-12 (1992)
11. Neznal, M., Neznal, M. and Šmarda, J. Temporal
Variability od Soil-Gas Radon Concentration - Some Remarks. In: Dubois,
C., ed. Gas Geochemistry. Northwood: Science Reviews, 529-534
(1995)
15. Neznal, M., Pernička, F. Temporal Changes of Soil-Gas Radon
Concentration at a Test Site - Uranium Mill Tailings. In: Barnet, I.
and Neznal, M., eds. Radon Investigations in CR. Vol. 6. Praha:
Geological Survey, 79-87 (1996)
Soil-gas radon concentration - Spatial variations & Statistical evaluation of data
In our experience, spatial variations of soil-gas radon concentrations
are more important than temporal ones. The soil-gas radon
concentrations may vary, often greatly, over a small distance. The
occurrence of heterogenities may indicate the presence of faults or
tectonic zones.
As the areas with a homogeneous geological structure and with a
homogeneous soil-gas radon concentration are rare, any evaluation based
on a single measurement is almost worthless.
On the other hand, the occurrence of spatial variations represents a
serious reason, why protection of a building should be based on the
results of a building site characterization and not on large scale
radon risk maps.
The frequency distribution of measured soil-gas radon concentrations need not be normal.
1993: Almost 90 randomly chosen data sets were analysed.
The distribution of a significant part of data sets was heterogeneous,
i.e. neither a normal nor a log-normal models were found to give an
adequate fit to the radon concentration data.
Robust nonparametric estimates such as the median or the third quartile
were therefore suggested for the description of the soil-gas radon
concentration data.
přidat odkaz na Reference, nebo přímo uvést
relevantní reference (číslování
odpovídá současnému stavu na www.radon-vos.cz):
8. Neznal, M., Neznal, M. and Šmarda, J. Evaluation of Soil-Gas
Radon Concentration Data - Some Remarks. In: Barnet, I. and Neznal, M.,
eds. Radon Investigations in CR. Vol. 5. Praha: Geological Survey,
37-41 (1994)
Soil-gas radon concentration - Variations introduced using different methods
A perfect sealing of all parts of the equipment is required especially
when soil-gas samples are taken from a low permeable soil. A
"contamination" of the soil-gas sample by the atmospheric air is a
frequent cause of variations.
Soil structures should not be disrupted during sampling
2001: Short-term intercomparison measurement using different measuring techniques has been organized.
Observed temporal changes were different in different measuring points,
or, more probably, these changes were caused mainly by fluctuations
connected with measuring methods themselves and they did not reflect
real variations of the measured parameter.
Recommendation:
- A background control of scintillation or ionizing chambers is required before sampling (instantaneous measurements).
- The internal volume of the cavity, which is created at the
lower end of the sampling probe, must be large enough to enable the
sample collection. The minimum internal surface area that must enter
the soil is 940 mm2 (corresponding to a cylinder having 10 mm in
diameter and 30 mm height).
- If the soil permeability is very low, the cavity at the lower end of
the sampling probe can be enlarged by retracting the probe about 10 -
15 cm toward the surface (in specific circumstances to 0.5 m below the
surface, while maintaining the perfect sealing of the whole system). A
similar approach is often used when the sampling layer is saturated
with water. In cases involving shallow solid rock layers, the minimal
sampling depth can be changed to 0.5 m below the surface.
References:
24. Matolín, M., Jáně, Z., Neznal, M., Neznal, M.
Geometry of Soil Gas Sampling, Soil Permeability and Radon Activity
Concentration. In: Barnet, I. and Neznal, M., eds. Radon Investigations
in CR. Vol. 8. Praha: Geological Survey, 27-29 (2000)
25. Neznal M., Neznal M., Determination of Soil Gas Radon Concentration
in Low Permeable Soils. In: Book of Abstracts, Seventh International
Symposium Natural Radiation Environment. Rhodes, 319 - 320 (2002)
29. Neznal M., Matolín M., Just G., Turek K., Short-term
Temporal Variations of Soil Gas Radon Concentration and Comparison of
Measurement Techniques. Rad. Prot. Dosim. 108, 55-63 (2004)
Soil permeability
Research
2001-2002: Detailed measurements from more than 20 areas have been used
for comparing the results obtained using different methods of
permeability determination (classification based on the vertical
profile assessment, direct in-situ measurements, classification derived
from particle size analysis of soil samples).
At most areas the final classification based on the vertical profile
assessment was consistent with the results of direct in-situ
measurements, and partly with the data derived from particle size
analysis.
Where the permeability derived from particle size analysis was
contradictory, the underestimation of permeability was caused mainly by
low soil moisture and/or by the occurrence of significant macro- and
micro-fissures.
Overestimated permeability could be observed especially in fine-grained sands with relatively high soil moisture.
Statistical evaluation: Individual permeability values are
substantially affected by small-scale changes of the measured soil
volume, especially in areas of medium to low permeability. The
statistical evaluation can be affected by the occurrence of high
permeability outliers, and by inexact values under the lower limit in
cases of extremely low permeability.
Conclusion: A large number of measurements should be required for evaluating in-situ measurements of permeability.
Nowadays practice
The permeability of soils can be determined by direct in situ
permeability measurements (the permeability is given in m2), or by
expert evaluation of permeability (leads to assigning the low –
medium – high categories).
Dirct in-situ permeability measurement: The methods consist of
measuring the airflow during suction from the soil or when pumped into
the soil under constant pressure.
The procedures for permeability measurements are similar to those of
soil gas sampling (small-diameter hollow steel probes with a free,
sharpened lower end - a lost tip; measurements are performed at a depth
of 0.8 m beneath the ground surface; at least 15 measuring
points; the third quartile of the data set is used as a decisive
value).
The internal surface area of the cavity formed by pounding out the free
tip must be exactly defined for each measurement system. Various
devices can be used.
But: no standardization available.
Due to the lack of the gas permeability standardization, the results
obtained from various devices should be standardized against the
RADON-JOK device, widely used in the Czech Republic.
Expert evaluation of soil permeability: The evaluation is based
on the description of the vertical soil profile to a minimum depth of 1
m, or to the lowest depth that can be reached by a hand drill (large
amounts of coarse material, or unweathered rock near the surface).
The evaluation must involve at least one of the following methods:
-
A macroscopic description of the fractions in samples from a depth of
0.8 m, with the classification of their permeability (low –
medium – high). Estimating the proportion of the fine fraction
(particle size <0.063 mm) is also necessary in this classification.
- Evaluating the resistance encountered when drawing the soil gas
samples for the radon concentration measurements at all sampling
points, and estimating the prevailing permeability category (low
– medium – high).
For a better evaluation of spatial variations, at least two hand drill
tests must be performed for small building sites (smaller than 800
m2).
Quality of permeability classification strongly depends on personal experience.
References:
28. Neznal M., Neznal M., Permeability as One of Main Parameters for
Radon Risk Classification of Foundation Soils. In: Book of Extended
Abstracts from the 7th International Conference on Gas Geochemistry.
Freiberg, 70 - 71 (2003)
Radon exhalation from the ground surface
2000 - 2001: A long-term follow-up at four reference areas has been carried out.
Spatial variations of radon exhalation rate are similar as spatial variations of soil-gas radon concentration.
Measured values of radon exhalation rate are strongly affected by
conditions on the soil surface (significantly lower values are observed
when the soil surface is frozen or covered by water; a decrease of
radon exhalation can be observed after a compression of the upper soil
layer caused by heavy machines during the harvest, etc.)
The temporal variability of radon exhalation rate from the ground
surface is significantly higher than the temporal variability of
soil-gas radon concentration if soil-gas samples are collected from a
depth of 0.8 m below the surface.
přidat odkaz na Reference, nebo přímo uvést
relevantní reference (číslování
odpovídá současnému stavu na www.radon-vos.cz):
27. Neznal M., Neznal M., Measurements of Radon Exhalation Rate from
the Ground Surface: Can the Parameter Be Used for a Determination of
Radon Potential of Soils? In: Barnet, I., Neznal, M. and
Mikšová, J. eds. Radon Investigations in the Czech
Republic. Vol.9. Praha: Geological Survey, 16 - 25 (2002)
Nowadays practice in the Czech Republic
About 100 institutions (mostly private firms) deal with the determination of radon index of building sites.
Each subject:
- has to pass the training course „Determination of radon index
of building sites“ organized by the Charles
University in Prague, Faculty of Science (duration: 20 hours; subjects:
Biological effects of ionizing radiation, Atomic Law and legal matters,
Radon programme, Determination of radon index of sites –
methodology);
- has to pass the comparison measurement of soil-gas radon
concentration at field radon reference sites (administrator: Charles
University in Prague, Faculty of Science; 3 different levels of
soil-gas radon concentration);
- has to verify regularly all masurement devices for the determination
of soil-gas radon concentration in radon chamber (National Institute
for Nuclear, Chemical and Biological Protection, Kamenna);
- has to get the authorization from the State Office for Nuclear Safety.
Note: The experience in the field of building site characterization is
very large in the Czech Republic. RADON v.o.s., which is one of private
firms dealing with building site characterization, has measured
building areas for almost 20 000 buildings and it has realized more
than 250 000 soil-gas radon concentration measurements since 1990.
Preventive measures in new houses - technical solutions, experiences
Czech National Standard CSN 730601 Protection of houses against radon from the soil (1995, 2000, 2006):
- concerns not only preventive measures in new houses, but also remediation of existing buildings;
- principles of designing and application of various types of radon reduction techniques;
- requirements for radon-proof insulation (membrane): only material
with measured radon diffusion coefficient can be used as a radon-proof
insulation.
Basic principles
Protection of new houses against radon penetration from the ground is
based on the use of radon-proof insulation; or radon-proof insulation
in combination with passive, or active ventilation systems. The main
advantage of radon proof insulation: it protects the building also
against dampness and water. The main disadvantage is the sensitivity to
puncturing.
Special attention must be given to jointing and to pipe penetration.
Passive ventilation systems must be installed in such a way that they can be easily changed to forced (active) systems.
Simple airing of the drainage layer by means of pipes that run from one
side of the building to another side is not a convenient
solution.
Recommended ventilation system: several perforated pipes that are
connected to one vertical exhaust pipe on which a fan can be installed
in the future.
Experiences
Realization of preventive measures against radon started in the Czech Republic more than 15 years ago.
Results of long-term measurements of indoor radon concentration
indicate that the protection has failed in a non-negligible number of
houses. Greater amount of failures has been found in houses built
before 1995, i.e. before publication of the first version of CSN 730601.
Factors responsible for failures:
- leakages in joints and around pipe penetration,
- partial application – insulation is not applied over the entire surface,
- perforation of insulation during construction works,
- use of insulating materials that were not tested on radon diffusion, or use of low quality products,
- passive ventilation with inlet and outlet holes in external walls only (without vertical exhaust).
References:
35. Neznal M., Neznal M., Jiránek M., Froňka A. Failure of
Preventive Measures against Radon Penetration from the Ground in a
New-Built Family House - a Case Study. In: Proceedings of Full Papers
CD-Rom from the 2nd European IRPA Congress on Radiation Protection.
Paris (2006)
|